The problem with tensile testing
Ultra-high strength steel is an established material in the automotive industry and is commonly used in selected structural body reinforcements, bumper reinforcements, door impact beams as well as seat frames and mechanisms.
Ultra-high strength steel is responsible for helping to achieve 5-star crash ratings and reducing component weight by up to 40 percent. It also allows OEMs to cut costs and become more efficient in production, while developing more innovative component designs that are more competitive on the market.
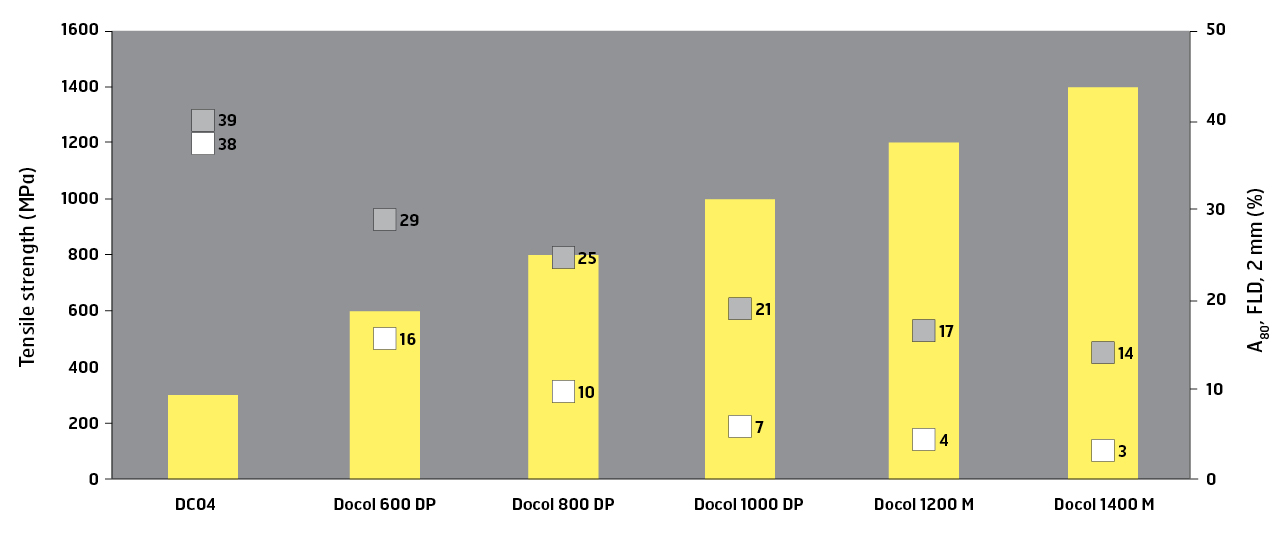
Despite the benefits, many OEMs are still choosing softer grades of steel and missing out on a competitive advantage. The reason is that they are relying solely on the elongation results of tensile tests when thinking about formability.
“The tensile test is the most frequently used test,” explains Dr. Lars Troive, a SSAB Senior Forming Specialist. “The idea is to pull the specimen apart until fracture. Then you measure how much it has extended in length. This is considered its elongation. For example, if the test piece measures 80 millimeters and then becomes 88 millimeters before cracking, it represents a 10 percent elongation.”
He goes on to say: “While the tensile test has long been the most common practice for judging the formability of steel, modern, stronger steel grades are not correctly represented by this method. This is because these stronger steels behave differently, having more local plastic deformation compared to conventional softer grades.”
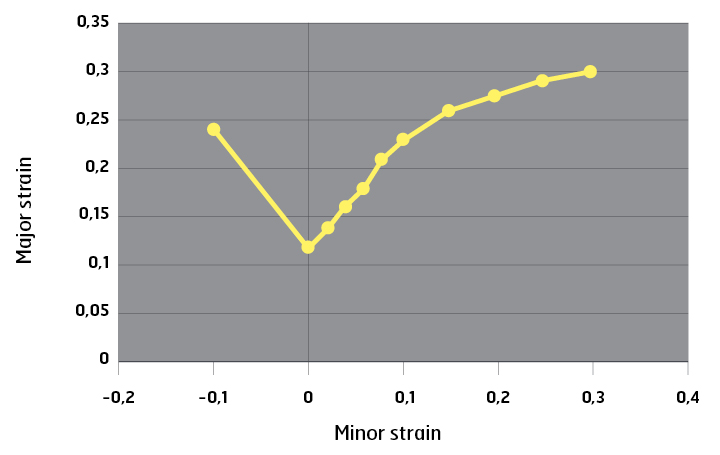
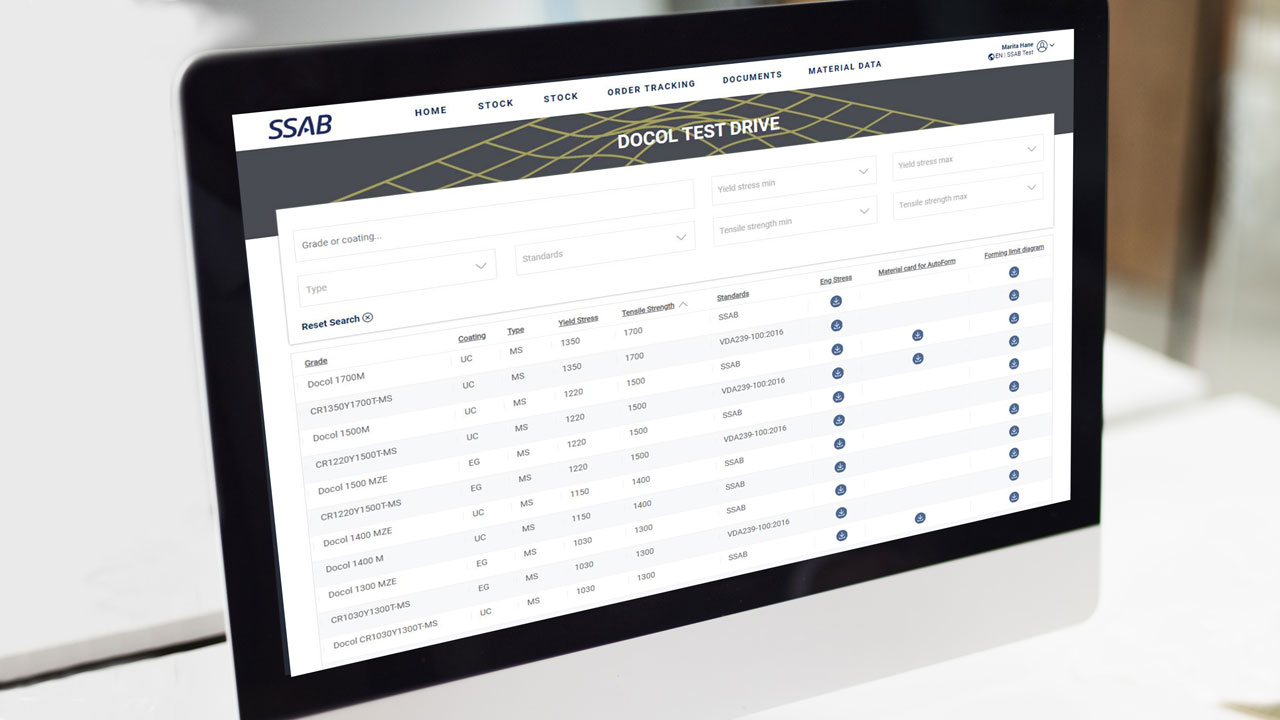
A more accurate way of predicting the behavior of ultra-high strength steel is through the creation of a forming limit diagram (FLD), also known as a forming limit curve. One single FLD provides a graphical description of several material failure tests performed, i.e., punched dome tests, using different specimen geometries. Each specimen (i.e., steel blank) has a unique width-to-length ratio resulting in different deformation modes until failure. They will deform differently, having their own strain-path.
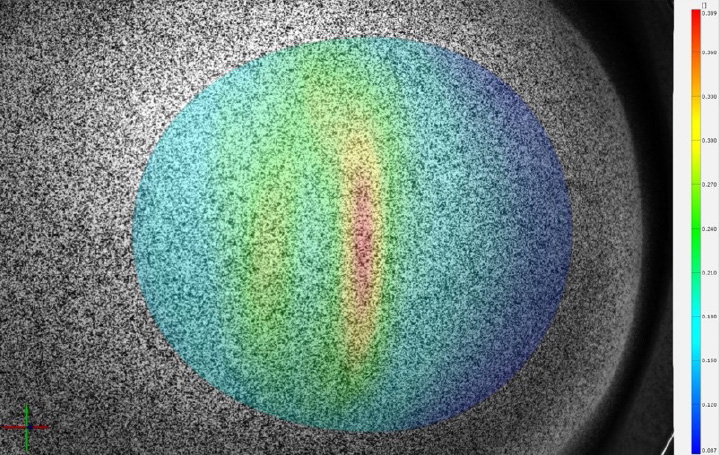
Before a FLD-test is performed, each specimen is first painted in white and then covered by black dots randomly distributed by spray-painting in a “speckle pattern.” The white base color is applied in order to get a good contrast to the black pattern.
During the tests, the speckle pattern is photographed by two cameras built into the press. The cameras capture the movements of every dot during the entire forming operation, which allows the estimation of the strain path until failure. As you perform the punched dome test on each of the different (blank) geometries, you will get two values for each test: the main and minor strains. The FLD is then drawn in a X- and Y-diagram, with a line connecting all of the obtained strain values. This curve represents the forming limit at which the steel is at a high risk for splitting (cracking).
